Mark Taylor maps an alternative Creative Christmas Economy.
This week saw the release of NESTA’s interactive data visualisations of the UK’s creative economy, which acknowledge the diversity of UK’s creative occupations. For the festive season, we’ve mapped two interpretations of the Christmas economy using Census data on occupations.
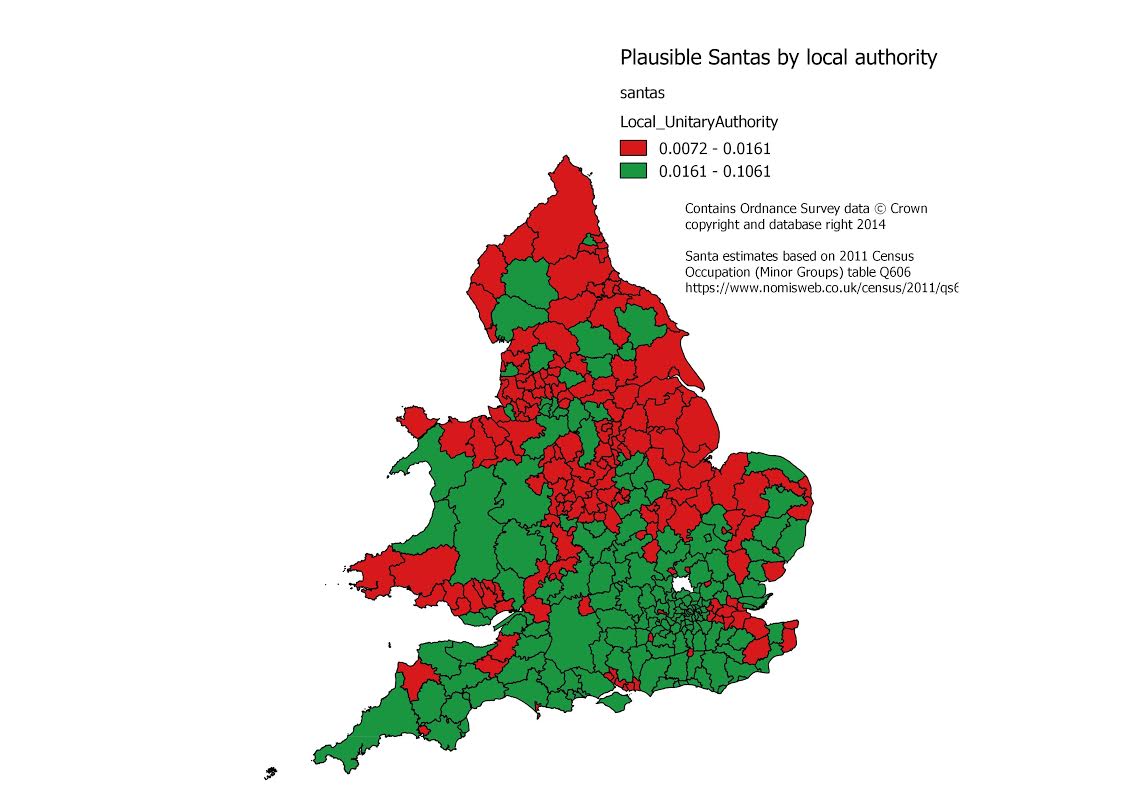
The first (below), suggests where Santas might reside across the UK, based on the occupations “Artistic, literary and media occupations“, and therefore includes actors (SOC2010 code 341);
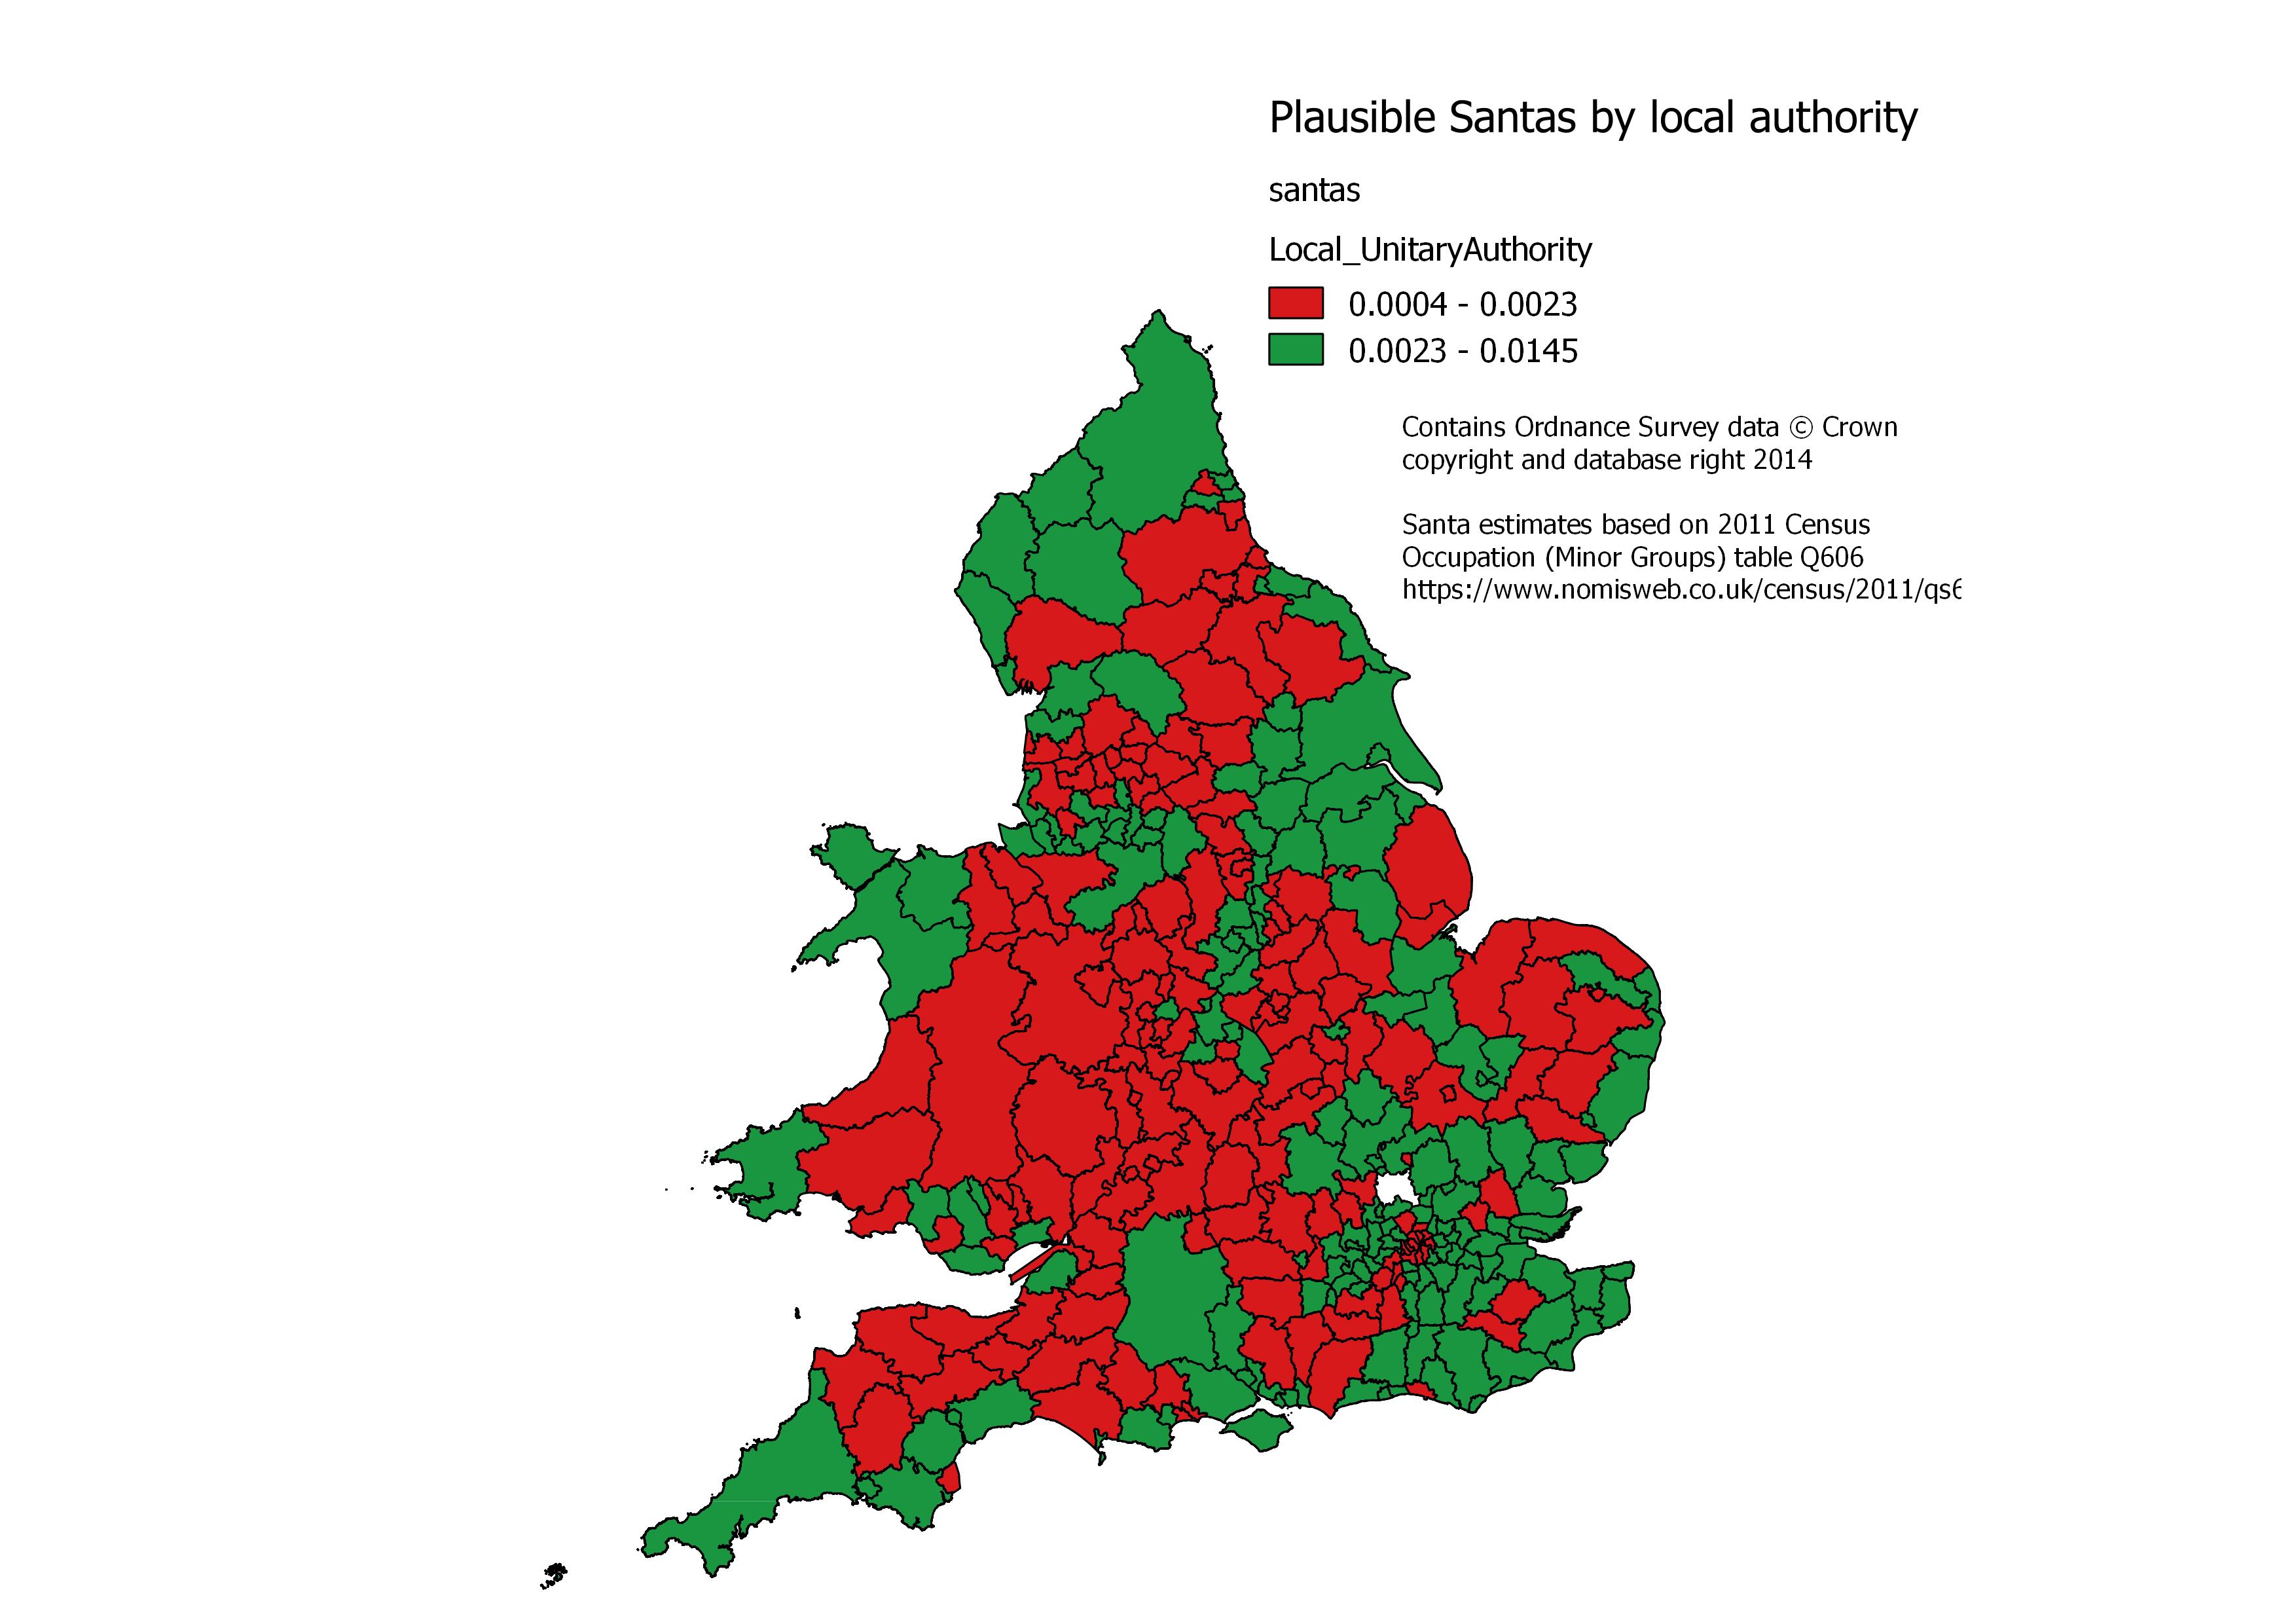
Second, is a more festive interpretation which includes “other drivers and transport occupations” (SOC2010 code 823).
Each map is colour-coded so that the local authorities with higher likelihood of a Santa-driven regional economy (the top half), are in green, and those less likely (the bottom half) are in red.
*Any Christmassy element of the colour scheme is a pure coincidence. Likewise, any insinuation that Santa may be an artistic fabrication is of course entirely incidental.
*Maps provided by Mark Taylor
**No Christmas markets were harmed in the creation of this post (or reindeers or santas).


